Reports overview
What the Reports home shows, how a report page is laid out and what every report counts.
Updated November 1, 2026
Reports turn your transactions and your plan into figures, charts and ranked lists. The Reports home has one card for each report. Select a card to open the full report.
Open Reports
Select Reports in the sidebar (on a phone, the Reports tab). Or press G, then R.
On the Budget page, the Full reports link at the bottom of the summary panel (on a smaller screen or a phone, the Month summary tab) opens Plan vs actual for the month you are viewing.
The Reports home
The page is titled Reports, with the current month under the title. It has no period or account controls. Each card names its own period and shows a figure, a small chart and one line.
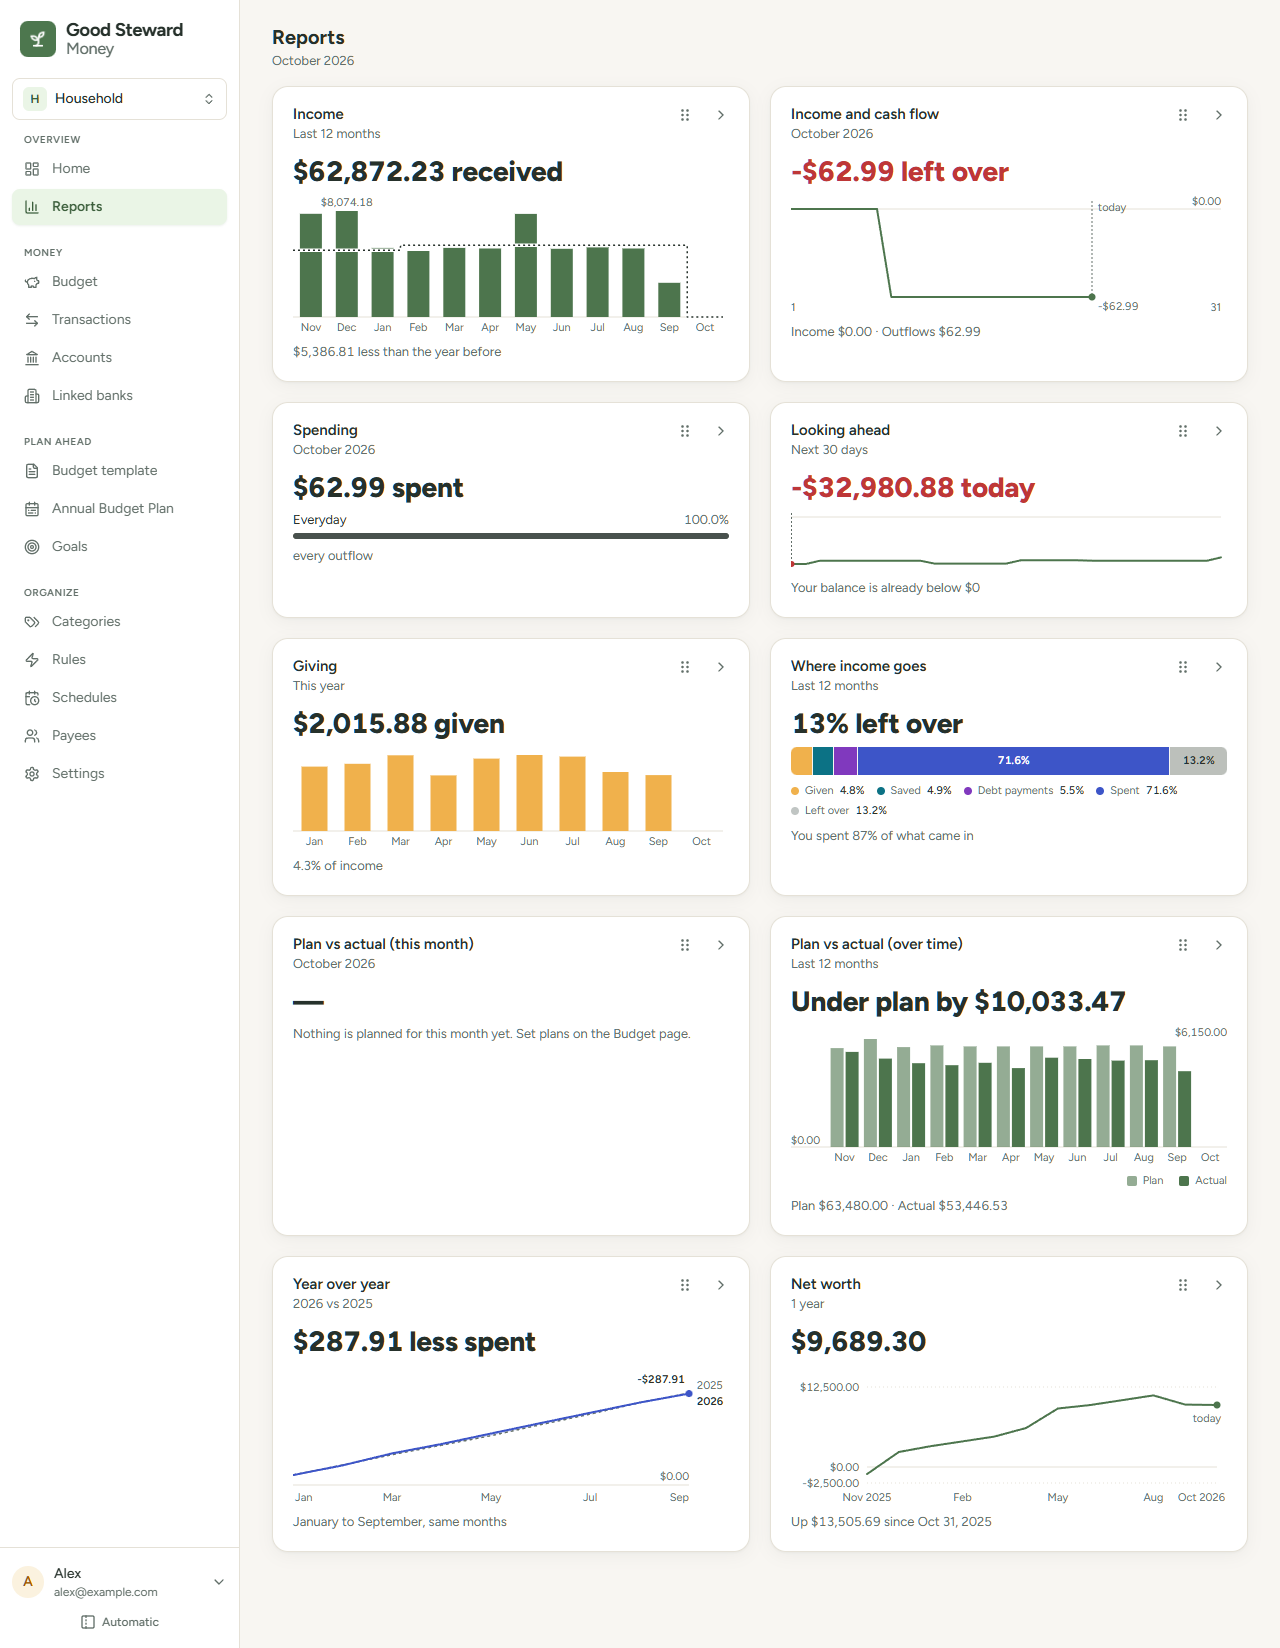
| Card | What it shows | Opens |
|---|---|---|
| Income | Money received in the last 12 months, compared with the 12 months before | Income |
| Income and cash flow | What is left over so far this month | Income and cash flow |
| Spending | Spending this month and the five largest groups | Spending |
| Looking ahead | Your balance today and over the next 30 days | Looking ahead |
| Giving | Giving this year and its share of income | Giving |
| Where income goes | How the last 12 months of income was given, saved, paid to debt, spent or left over | Where income goes |
| Plan vs actual (this month) | What is left of this month's plan | Plan vs actual |
| Plan vs actual (over time) | Plan against actual for the last 12 months | Plan vs actual |
| Year over year | This year's spending against last year's for the same months | Year over year |
| Net worth | What you own minus what you owe today, and how it changed over a year | Net worth |
Each saved view adds a card at the end. Drag any card to move it. See Save a report view.
A budget with no transactions shows Nothing to report yet and an Add or import transactions button instead of cards.
Parts of a report page
Report pages share this layout, top to bottom:
- Title: the report name, with a ‹ Reports link back to the Reports home.
- Controls: chips for the period, comparison and accounts. See Report controls.
- Headline: the main figure, with a line under it, such as "$1,140.00 left over".
- Charts and lists: select a row to open its detail or to see its transactions in the ledger. A legend under a chart or a list of bars names its marks, such as Spent, Average or Refunded. A short sentence under the legend gives a rule that a mark cannot show, such as "Tallest column is the largest month."
- Links at the bottom: How this is calculated expands that report's rules in plain language. Export CSV downloads the report as a spreadsheet file. Save this view keeps the page's setup as a card on the Reports home.
With Privacy mode on, amounts on reports are blurred, and the words around them stay readable. One label is an exception: on the Plan vs actual pace chart, the label such as "$40.00 over pace" blurs as a whole. Point at an amount to read it.
What reports count
Reports count transactions in on-budget accounts. These rules apply to every report except Net worth. Looking ahead starts from the current balance of your open on-budget accounts, which includes every transaction in them, and applies these rules to the spending and averages it adds.
| Transaction | How reports treat it |
|---|---|
| In an off-budget account | Not counted |
| In a category set to Off-budget | Not counted |
| Transfer between two on-budget accounts | Not counted, because money only moved |
| Transfer to or from an off-budget account | Counted under its category |
| Refund | Lowers the category it came back to |
| In a hidden category, or a category in a hidden group | Counted like any other. A report that lists the category shows it with a small hidden label after its name, wherever it has an amount in the report. Totals and shares do not change |
| Split transaction | Each part counts under its own category |
| Starting balance | Never counted as income or spending |
| No category | Money out counts as an outflow and money in as income, each shown as Uncategorized. Plan vs actual leaves it out and says how much |
Net worth counts every open account, on-budget and off-budget, including starting balances. It leaves out closed accounts.
If a total looks wrong, see A report's numbers don't match what I expect.
Reports on a phone
On a phone, Reports is the fourth tab in the bottom bar. The figures are the same as on a computer, but the Flow diagram and the Treemap are not offered.
On a smaller screen or a phone, most reports use a stacked layout. Charts sit under the headline, and a selected row's detail opens under the row instead of beside the list.