Read Income and cash flow
See how much came in, where it went by kind, and what was left over for a month or a longer period.
Updated November 10, 2026
Income and cash flow shows how much came in, where it went by kind of outflow, and what was left over.
Steps
- Select Reports in the sidebar (on a phone, the Reports tab), then the Income and cash flow card.
- Select a period chip or Pick months. The report opens on This month. See Report controls.
- To compare, select vs previous. The page adds a "Showing" line and the difference in what was left over, such as "$1,446.36 lower than May 1, 2026 – Jul 7, 2026". If the earlier period's left over is $0.00, it reads "Not enough history to compare to" and the dates.
- To count some accounts only, select the accounts chip, choose the accounts and select Apply.
- To look at one month of a longer period, select a month chip or a month's column in the chart. Select it again to clear it.
- Under Income, select By payee or By category.
- Select a name or bar to see its transactions in the ledger. Select the arrow beside an outflow group to open its categories.
- Select Flow diagram to see income flow into each kind of outflow. Select Bars to go back. The diagram is not available on a phone.
What the page shows
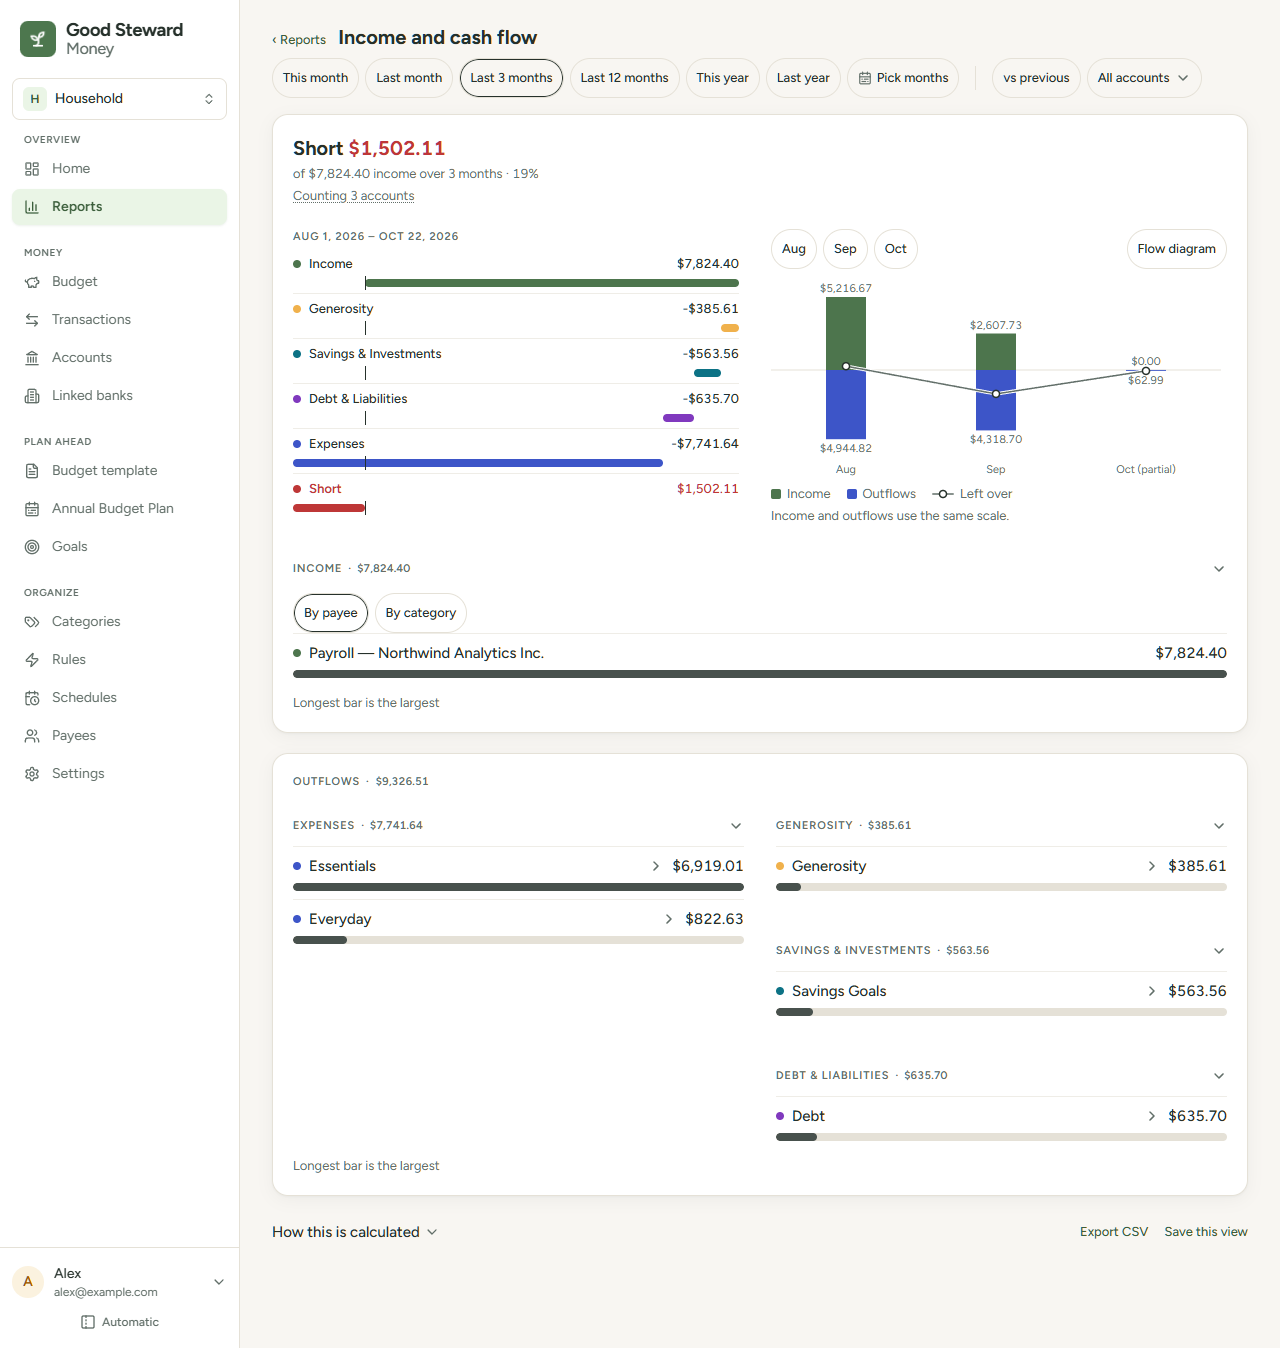
- Headline: "$1,140.00 left over" is income minus every outflow. For this month, the line under it reads "so far this month · Income $4,200.00 · Outflows $3,060.00". When more went out than came in, the figure reads "Short $149.00" in red. For any other period, the line gives the income and the share of it left over or short, such as "of $15,920.00 income over 3 months · 9%".
- Chart: for this month, a line shows the running net from $0, day by day. For any other period, each month has a column: income up, outflow down, and a dot for left over. The current month is marked "(partial)". On a phone, each month has one column, up when money was left over and down when it was short.
- Chart legend: under each chart, a legend names the marks. The daily line has Running net and Today. The monthly columns have Income, Outflows and Left over. The phone's columns have Left over and Short. With vs previous on, a dashed line for the earlier period is named Compared period. An item shows only when the chart draws it. Under the legend, one sentence gives the rule that no mark shows, such as "Income and outflows use the same scale."
- Waterfall: income, then Generosity, Savings & Investments, Debt & Liabilities and Expenses as minus figures, an Uncategorized row when money out has no category, then Left over or Short.
- Largest transactions: when one month is in view, up to 10 of its biggest transactions, with See all in the ledger.
- Income and Outflows: ranked lists, with the longest bar the largest. Outflows are grouped by kind, then by category group.
Notes
- Saving counts as an outflow. Left over is income minus giving, saving, debt payments, expenses and money out with no category.
- Money in with no category counts as income.
- The ledger you open from an Uncategorized row lists a split transaction in full, with all its lines, when one of its lines has no category.
- A period longer than 36 months shows one column for each calendar year and no month chips. A note reads "Grouped by calendar year because the range is longer than 36 months."
- A hidden category still counts. In the category lists, and in Largest transactions when a transaction has no payee, its name is followed by a small hidden label.