Check your plan with Plan vs actual
See how this month, or a longer period, is going against your plan, category by category.
Updated November 1, 2026
Plan vs actual compares each category's plan on the Budget page with what happened.
Check one month
- Select Reports in the sidebar (on a phone, the Reports tab), then the Plan vs actual (this month) card.
Read the headline. "$751.00 left" is the unspent part of the plan. "Over plan by $260.00" means spending passed it. From the 8th of the month, a pace line says whether spending is ahead of, behind or on pace.
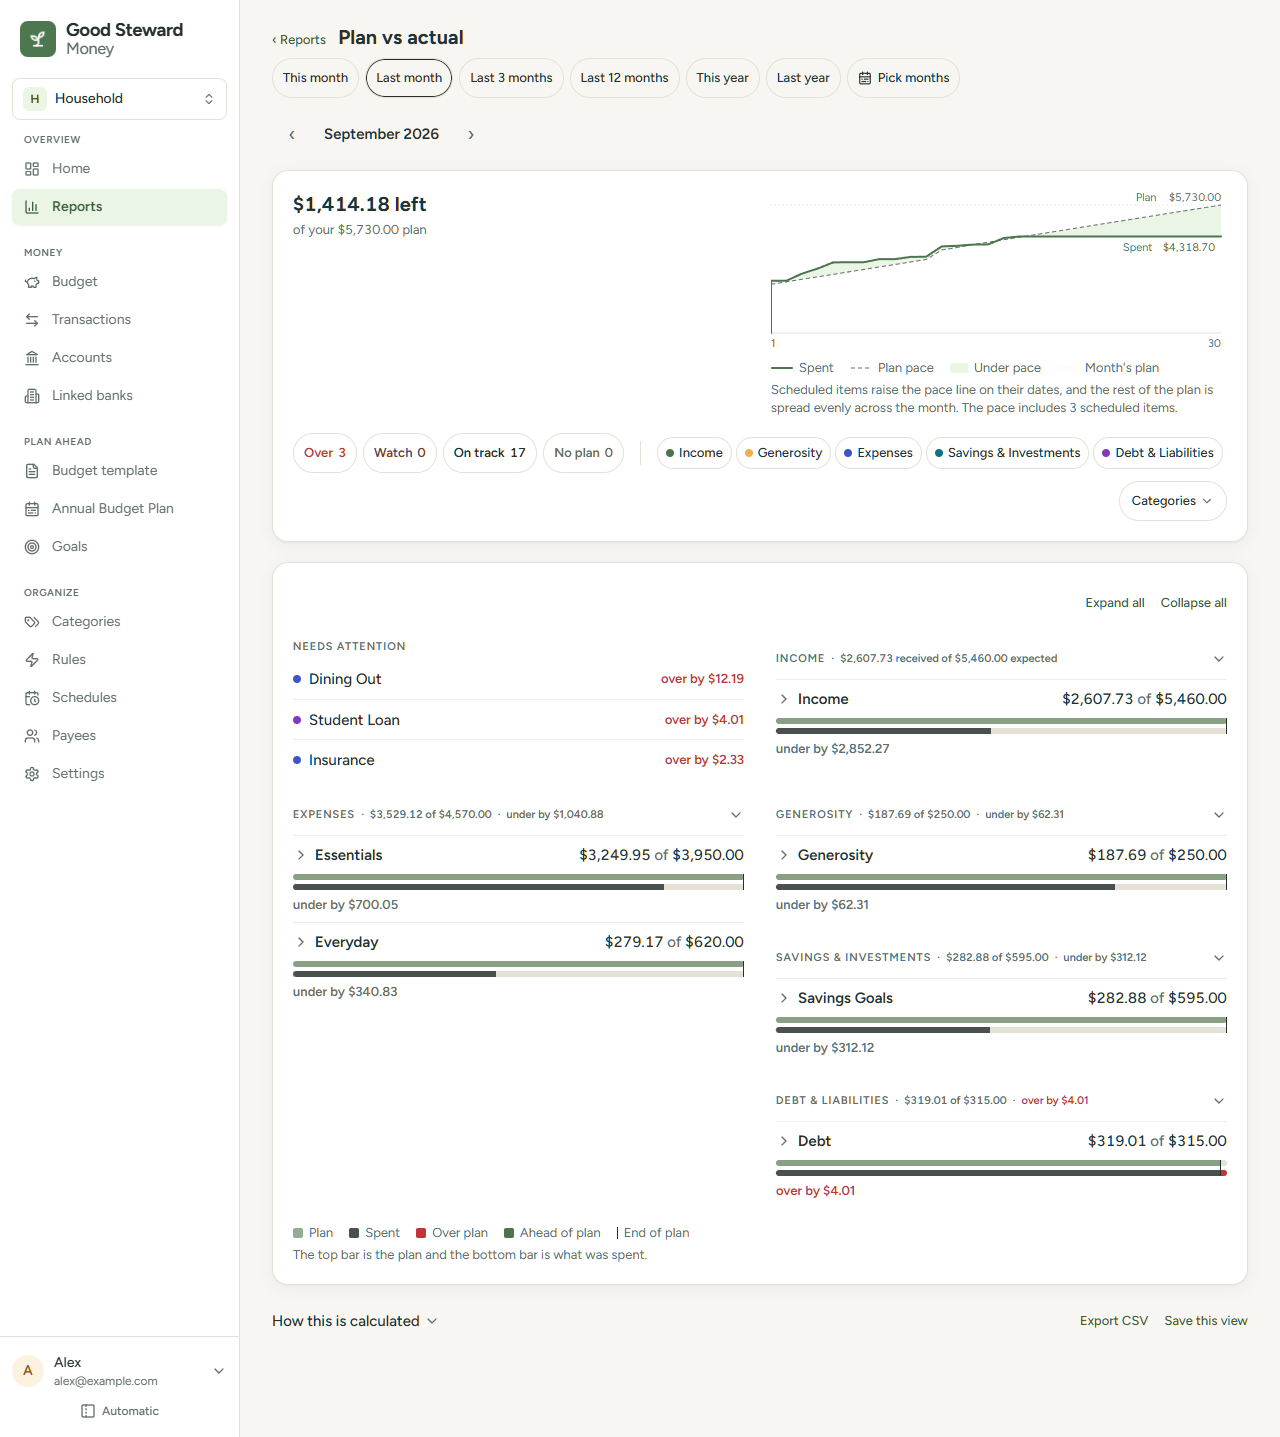
- Read the chart. The solid green line is what you have spent so far, labelled Spent. The dashed grey line is the plan's pace, labelled Plan. The tint between them shows how far under or over pace you are, and the bar at today shows the gap when there is room for it, with its figure beside it when there is room for that too. A legend under the chart names each mark: Spent, Plan pace, Under pace or Over pace (the tint), Month's plan (the dotted line at the plan's total) and Today. An item shows only when the chart draws it, so a finished month has no Today. A sentence under the legend says how the pace line is built: "Scheduled items raise the pace line on their dates, and the rest of the plan is spread evenly across the month." When scheduled items are in the pace, a second sentence counts them, such as "The pace includes 3 scheduled items."
- Select ‹ or › to change the month.
- Narrow the list with a status chip, a kind chip or Categories (select items, then Apply). Select an active chip again to remove it.
- Select a group row to open or close it, or select Expand all or Collapse all.
- Select a category row to list up to 10 of its transactions in that month under Largest transactions, with a See all in the ledger link. Select Close (the X) to close the list.
A row shows "$152.19 of $140.00" (spent, then plan).
Each row has two bars. The top bar is the plan and the bottom bar is what was spent. A legend under the lists names what the bars draw: Plan, Carried in (the hatched part of the plan that came from earlier months), Spent, Over plan, Giving over plan, Ahead of plan, Refunded (the hatched end of the spent bar), End of plan (the upright mark where the plan ends) and Today (a short mark on the spent bar that shows how much of the month has passed, on rows with three or more transactions). An item shows only when a row draws it. A sentence under the legend reads "The top bar is the plan and the bottom bar is what was spent."
| Status | Meaning |
|---|---|
| Over | Expenses, debt or giving passed the plan by more than $1 |
| Watch | Under plan, but 85% or more is used with over 15% of the month left, or on pace to pass the plan by over 10% (needs 3 or more transactions). A category with one transaction is never on watch. Income and saving more than 10% behind pace also show here |
| On track | Everything else with a plan |
| No plan | Money went out in a category with no plan. Select set a plan to open the Budget page at that month |
Needs attention lists up to five rows: most over plan first, then the largest unplanned spending, then income and saving that are behind. A Rollover category adds what it carried in to its plan.
Check several months
- Select the Plan vs actual (over time) card on the Reports home, which opens Last 12 months. Or, on the report, select a period chip other than This month and Last month, or select Pick months (whole months only).
- Read the headline, such as "Under plan by $8,707.00", with "Plan" and "Actual" totals under it. This year adds a pace line ("At this pace, $1,200.00 less by December."), a "Net:" line and a table by kind. The chart beside the headline has a pair of columns for each month from the first month with a plan, the plan first and then the actual. Months before that are left out, and a month inside the period with no plan keeps an empty place. With only one month planned there is no chart, and a sentence under the figures reads "The chart appears once two months have a plan." The Reports home card follows the same rule. Its legend names them Plan and Actual, and This month so far for the hatched column of the current month.
- Narrow the list with Over, On track, No plan, the kind chips or Categories. Income stays out until you select its chip.
- Select By month to add a box for each month under each category. Red is over plan (gold for giving), green is under, and grey is within $1. For income and saving, green is ahead and orange is behind. A dashed outline is a month with no plan or one still to come. A second legend under the lists names these: Over plan, Giving over plan, Ahead or under plan, Behind plan, Within $1 and No plan or not yet, with Larger difference for the shades. A sentence under it reads "A deeper shade means a larger difference, measured against the row's largest month." An item shows only when a month draws it.
Select Amounts to show a grid with each category's plan and actual in each month, plus a total and an average. Select By month or Amounts again to turn it off.
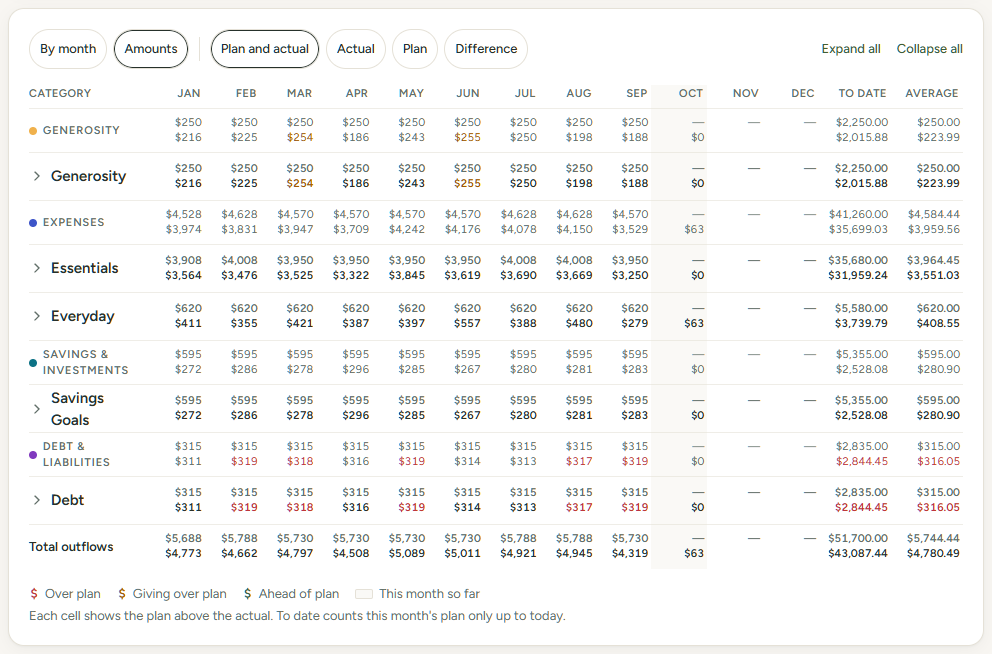
- Select a category row for its plan and actual in each month. On a phone, the row's month list opens under it. In the Amounts grid on a wide screen, a category's name opens its transactions in the ledger instead.
Choose what Amounts shows
Amounts opens on Plan and actual. On a wide screen, the Show choices next to the Amounts toggle change every cell. Select one:
| Choice | What each cell shows |
|---|---|
| Plan and actual | The plan on top, in grey, and the actual under it. A month with no plan shows "—" on top |
| Actual | The actual alone |
| Plan | The plan alone. The total is the plan for every month in the grid |
| Difference | One signed figure. A plus sign is left over or ahead of plan. A minus sign is over plan or short |
For spending (Expenses, Generosity, Debt & Liabilities), the difference is plan minus actual. For Income, Savings & Investments and Net, it is actual minus plan. In Plan and actual and Difference, red is over plan, gold is giving over plan, and green is ahead of plan. Each needs a gap of more than $1. A legend under the grid shows each color as a colored $ sign: Over plan, Giving over plan and Ahead of plan. Only the colors the grid uses are listed. Difference also lists Left over or ahead (the + sign) and Over or short (the - sign). Plan and actual adds the sentence "Each cell shows the plan above the actual." Actual and Plan color nothing and have no legend.
On This year the grid has all twelve months. A month still to come shows only its plan, and is empty in Actual and Difference. When the grid holds the current month, Plan and actual and Difference shade its column, and the legend lists it as This month so far. Its cell compares the actual so far with the whole month's plan. The To date column counts that month's plan only as far as today, and the legend says so: "To date counts this month's plan only up to today." On a period that ended before this month, and in Plan, that column is Total. Month cells show whole dollars. To date (or Total) and Average keep cents.
To date and Average leave out months before your budget's first month, for the plan and for the actual, in every Show choice. The month cells still show those months, and a Total column counts them. Average is the mean of the months from then on that have finished. It reads "—" when none has finished yet, such as when your budget began this month. In Plan, Average is the plan for all the grid's months divided by the number of those months from your budget's first month on. If your budget has no first month on record, such as one imported from Good Steward Local, it starts at the first month in which any category has a plan.
On a phone there are no Show choices. Each category has its actual to date, a small chart of paired columns for each month (plan, then actual) and a line with its plan and its usual words, such as "of $1,200.00 planned · under by $234.12". A legend above the list names the columns Plan and Actual, and This month so far for a hatched column. The Show choice is part of a saved view and of the address. Export CSV still holds the actuals, and its Average cell is empty when the page shows "—".
A category with no plan in any month is listed under Spent without a plan.
A hidden category that has a plan or spending in the period is listed with a small hidden label after its name, in the lists, the grid, the detail panel and the Categories choices. Its figures count like any other category's.