How the Budget page works
What the Budget page shows for one month: the headline figures, the columns, how Balance is worked out and the Month summary.
Updated October 30, 2026
The Budget page shows one month of your budget. For each category, it compares what you planned with what happened, using the transactions you have recorded.
Select Budget in the sidebar (on a phone, the Budget tab). The page opens on the current month, unless you pinned another month.
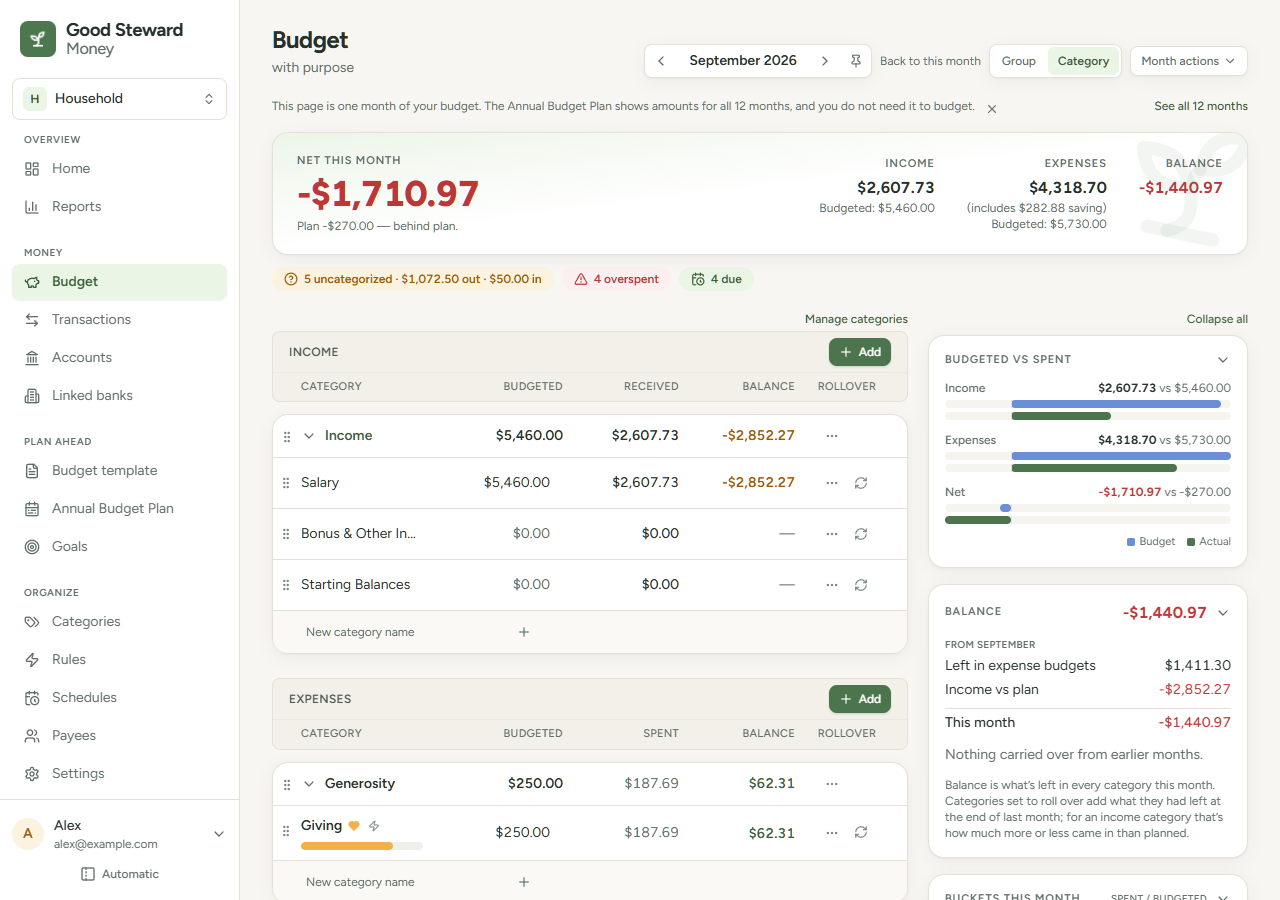
From top to bottom, the page has the month controls, the headline band, the attention chips, and the Income and Expenses sections. The Month summary is at the right. Groups under Expenses follow the order of their money bucket.
Above Income, at the right, Manage categories opens the Categories page. The three-dot button on a category row or a group header opens a menu with Rename or Rename group. See Manage categories and groups.
The columns
In Category view, each category row has these columns. Group view shows the same figures, one line per group.
| Column | Meaning |
|---|---|
| Budgeted | Your plan for this category this month. You can edit it. |
| Spent (Received for income) | The total of transactions in this category dated in the month. Select the amount to see them. |
| Balance | What is left, or how far over you are. |
| Rollover | A button that carries the Balance into next month. See How Rollover works. |
Balance is worked out per row:
- Expense category: Budgeted - Spent + any amount carried in from last month.
- Income category: Received - Budgeted + any amount carried in.
A negative expense Balance shows in a red badge and tints the row. Giving categories, marked with a heart, use gold instead of red. The bar under an expense category's name shows spending as a share of the money available: Budgeted plus anything carried in. When a category is overspent, the bar is full. The part up to the money available is green and the part beyond it is red. The red part is the overspend as a share of what you spent, so a small overspend is a thin red end and a large one is mostly red. In a giving category, the whole bar is gold, including the overspent part.
The headline band
- Net this month: income received minus money spent. It turns red below zero. The line under it shows the planned net (planned income minus planned spending), for example "Plan $2,200.00", and whether you are "ahead of plan" or "behind plan".
- Income: income received. Budgeted under it is the planned income.
- Expenses: money spent in every expense category, including Generosity, Savings & Investments and Debt & Liabilities. Budgeted under it is the planned spending. Money that went to savings groups also shows as "(includes $X saving)".
- Balance: the sum of the Balance of every category. It equals actual net minus planned net, plus anything carried in. It turns red below zero. When part of it was carried in from earlier months, "Carried over: $X" appears under it. Select that line to open the Month summary at its Balance card.
On a phone, Income, Expenses and Balance sit on one line with nothing under them. Select the line to open the Month summary, which shows the budgeted amounts and the carried amount.
Example
September 2026:
| Category | Budgeted | Spent or Received | Balance |
|---|---|---|---|
| Paycheck (income) | $5,000.00 | $5,200.00 | +$200.00 |
| Groceries | $800.00 | $750.00 | $50.00 |
| Rent | $1,800.00 | $1,800.00 | $0.00 |
| Fuel | $200.00 | $260.00 | -$60.00 |
- Income: $5,200.00. Expenses: $2,810.00.
- Net this month: $5,200.00 - $2,810.00 = $2,390.00.
- Planned net: $5,000.00 - $2,800.00 = $2,200.00, so you are ahead of plan.
- Balance: $200.00 + $50.00 + $0.00 - $60.00 = $190.00, which is $2,390.00 - $2,200.00.
What counts
- Transactions with a category, in on-budget accounts, in the month of the transaction date. See On-budget and off-budget accounts.
- Transfers between two on-budget accounts do not count.
- Transactions without a category are not in any figure. The uncategorized chip counts them.
- Categories you set to off-budget are not listed and not counted.
- Hidden categories and groups are counted in every figure. Where a hidden category has a plan, spending or an amount carried in, Budget lists it with a small hidden label, so the headline figures equal the sum of the rows you see. With no amount in the month it has no row. Automatic fills, such as Copy last month's budget and Fill empty categories, skip hidden categories. See Manage categories and groups.
Month summary
On a wide screen, the Month summary is a column on the right. On a smaller screen or a phone, select the Month summary tab on the right edge to open it as a panel. It shows these cards, in this order:
- Budgeted vs spent: income, expenses and net, each as actual against budget.
- Balance: what the Balance in the headline band is made of, described below.
- Buckets this month: spent against budgeted for each money bucket.
- A card titled with the year, such as 2026 outlook: Income YTD, Spending YTD, Net YTD and Projected year-end net (the net so far plus the planned net for the remaining months).
- Over plan: up to five overspent categories with their Balance. Hidden categories are included, with the hidden label. Overspent giving categories are listed under "Gave beyond plan". When no category is over, the card reads "Every category is within budget."
- Top spending: the five categories with the most spending this month. Hidden categories are included, with the hidden label.
Select Full reports to open the Plan vs actual report for the month.
The Balance card
The Balance card splits the Balance figure in two. The total is beside the card's title.
- From the month, for example "From September": Left in expense budgets, Income vs plan and This month. This month is the two lines above it added together. It equals Net this month minus Plan.
- Carried over from earlier months: Income categories and Expense categories, each with the number of categories that carried an amount, and Carried over, their total. When nothing carried over, the card reads "Nothing carried over from earlier months."
- Largest carried amounts: up to three categories with the largest carried amounts. Select a name to go to its row (in Group view, to its group). A hidden category is listed with the hidden label, and links to its row like any other.
This month plus Carried over equals the Balance in the headline band. See How Rollover works.
Collapse the cards
Select a card's title to collapse it to one line. Select it again to open it. Select Collapse all or Expand all at the top of the panel to change every card at once. Every card starts open. Your choice is saved in your browser, not in your account.
A collapsed card shows one summary:
| Card | Summary when collapsed |
|---|---|
| Budgeted vs spent | Spent, then budgeted, for example "$2,810.00 / $2,800.00" |
| Balance | The Balance total. When something carried over, "This month $X · Carried over $Y" appears under it. |
| Buckets this month | One small bar for each bucket. An overspent bucket's bar ends in a red part (gold for Generosity). |
| Year outlook | The projected year-end net, followed by "year-end" |
| Over plan | The number of categories over plan, or "None". Giving categories over plan are counted after a heart. |
| Top spending | The category with the most spending, and its amount |
The Annual Budget Plan shows all 12 months and edits the same Budgeted amounts. You do not need it to budget.
On a phone
Rows stack. Under each category name, the line reads Spent $X · Left $Y, where Left is the Balance. Income rows read Received $X · Diff +$Y. Savings & Investments groups read Saved instead of Spent. The headline band shows Income, Expenses and Balance on one line. Select it to open the Month summary.